
- Тип техники
- Бренд
Просмотр инструкции весов BEURER BF 700, страница 17
17
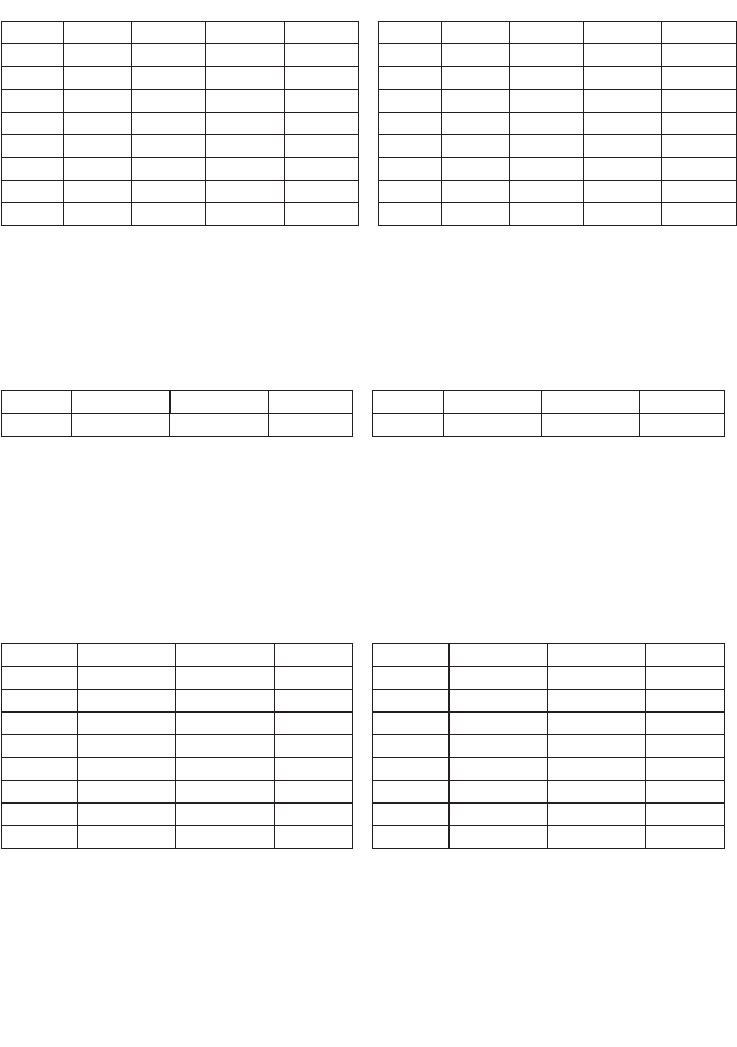
9. Evaluation of results
Body fat percentage
The following body fat percentages are guide values (contact your physician for further information).
Man Woman
Age low normal high very high Age low normal high very high
10 –14 <11 % 11–16 %
16,1– 21 %
>21,1 % 10 –14 <16 % 16 – 21 %
21,1– 26 %
>26,1 %
15 –19 <12 % 12 –17 %
17,1– 22 %
>22,1 % 15 –19 <17 % 17– 22 %
22,1– 27 %
>27,1 %
20 – 29 <13 % 13 –18 %
18,1– 23 %
>23,1 % 20 – 29 <18 % 18 – 23 %
23,1– 28 %
>28,1 %
30 – 39 <14 % 14 –19 %
19,1– 24 %
>24,1 % 30 – 39 <19 % 19 – 24 %
24,1– 29 %
>29,1 %
40 – 49 <15 % 15 – 20 %
20,1– 25 %
>25,1 % 40 – 49 <20 % 20 – 25 %
25,1– 30 %
>30,1 %
50 – 59 <16 % 16 – 21 %
21,1– 26 %
>26,1 % 50 – 59 <21 % 21– 26 %
26,1– 31 %
>31,1 %
60 – 69 <17 % 17– 22 %
22,1– 27 %
>27,1 % 60 – 69 <22 % 22 – 27 %
27,1– 32 %
>32,1 %
70 –100 <18 % 18 – 23 %
23,1– 28 %
>28,1 % 70 –100 <23 % 23 – 28 %
28,1– 33 %
>33,1 %
A lower value is often found in athletes. Depending on the type of sports, training intensity and physical
constitution, values may result which are below the recommended values stated. It should, however, be
noted that there could be a danger to health in the case of extremely low values.
Body water percentage
The body water percentage is normally within the following ranges:
Man Woman
Age poor good very good Age poor good very good
10 –100 <50 % 50 – 65 % >65 % 10 –100 <45 % 45 – 60 % >60 %
Body fat contains relatively little water. Therefore persons with a high body fat percentage have body
water percentages below the recommended values. With endurance athletes, however, the recommended
values could be exceeded due to low fat percentages and high muscle percentage.
This scale is unsuitable for measuring body water in order to draw medical conclusions concerning age-
related water retention, for example. If necessary ask your physician. Basically, a high body water percent
-
age should be the aim.
Muscle percentage
The muscle percentage is normally within the following ranges:
Man Woman
Age low normal high Age low normal high
10 –14 <44 % 44 – 57 % >57 % 10 –14 <36 % 36 – 43 % >43 %
15 –19 <43 % 43 – 56 % >56 % 15 –19 <35 % 35 – 41 % >41 %
20 – 29 <42 % 42 – 54 % >54 % 20 – 29 <34 % 34 – 39 % >39 %
30 – 39 <41 % 41– 52 % >52 % 30 – 39 <33 % 33 – 38 % >38 %
40 – 49 <40 % 40 – 50 % >50 % 40 – 49 <31 % 31– 36 % >36 %
50 – 59 <39 % 39 – 48 % >48 % 50 – 59 <29 % 29 – 34 % >34 %
60 – 69 <38 % 38 – 47 % >47 % 60 – 69 <28 % 28 – 33 % >33 %
70 –100 <37 % 37 – 46 % >46 % 70 –100 <27 % 27 – 32 % >32 %
Bone mass
Like the rest of our body, our bones are subject to the natural development, degeneration and ageing pro
-
cesses. Bone mass increases rapidly in childhood and reaches its maximum between 30 and 40 years of
age. Bone mass reduces slightly with increasing age. You can reduce this degeneration somewhat with
healthy nutrition (particularly calcium and vitamin D) and regular exercise.
With appropriate muscle building, you can also strengthen your bone structure. Note that this scale will
not show you the calcium content of your bones, but will measure the weight of all bone constituents
Ваш отзыв будет первым